vue-chartjsを使ってVue.jsでキレイなグラフを描画する
Chart.jsをVueで使用するためのラッパーであるvue-chartjsを使って、キレイなグラフを描画していきたいと思います。
vue-chartjsのインストール
npm install vue-chartjs chart.jsグラフを描画するcomponent作成
componentsディレクトリにBarChart.vueを作成します。
<script>
import { Bar } from "vue-chartjs";

export default {
  extends: Bar,
  mounted() {
    this.renderChart(
      {
        labels: [
          "2019/09/01",
          "2019/09/02",
          "2019/09/03",
          "2019/09/04",
          "2019/09/05",
          "2019/09/06",
          "2019/09/07",
          "2019/09/08",
          "2019/09/09",
          "2019/09/10"
        ],
        datasets: [
          {
            backgroundColor: "rgba(60,141,188,0.9)",
            borderColor: "rgba(60,141,188,0.8)",
            pointRadius: false,
            pointColor: "#3b8bba",
            pointStrokeColor: "rgba(60,141,188,1)",
            pointHighlightFill: "#fff",
            pointHighlightStroke: "rgba(60,141,188,1)",
            data: [28, 48, 40, 19, 86, 27, 90, 28, 48, 40]
          },
          {
            backgroundColor: "rgba(210, 214, 222, 1)",
            borderColor: "rgba(210, 214, 222, 1)",
            pointRadius: false,
            pointColor: "rgba(210, 214, 222, 1)",
            pointStrokeColor: "#c1c7d1",
            pointHighlightFill: "#fff",
            pointHighlightStroke: "rgba(220,220,220,1)",
            data: [65, 59, 80, 81, 56, 55, 40, 65, 59, 80]
          }
        ]
      },
      {
        responsive: true,
        maintainAspectRatio: false,
        scales: {
          xAxes: [
            {
              stacked: true
            }
          ],
          yAxes: [
            {
              stacked: true
            }
          ]
        }
      }
    );
  }
};
</script>※グラフを描写するcomponentのVueファイルに<template>タグは使えないので注意!
グラフを表示するVueにcomponent配置
グラフを表示させたいVueファイルに、先程のグラフを描写するcomponentを配置します。
<template>
  <div>
    <bar-chart />
  </div>
</template>

<script>
import Vue from 'vue'
import BarChart from '@/components/BarChart'

export default {
  components: {
    BarChart
  }
}

Vue.component('bar-chart', BarChart)
</script>
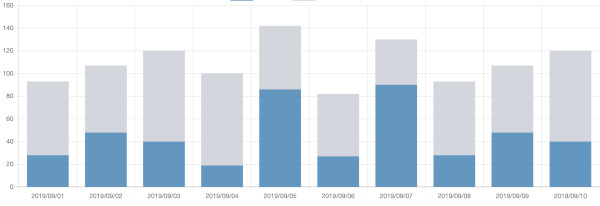
これで下記のようなキレイなグラフが簡単に描けます。

基本的にはChert.jsで用意されているオプションを使用できるので、棒グラフや線グラフ、円グラフ、分布図、レーダーチャートなどなど、様々なグラフにカスタマイズ出来ます。
またVueならではのチャートデータを動的に更新してのグラフ描写も可能なようですよ。
